


Senator Roberts Charts Out Declining US COVID Death Rate
ROBERTSON COUNTY TENNESSEE: (Smokey Barn News) – Senator Kerry Roberts produced a chart graphing out the declining COVID-19 death rate in the US and posted the chart on his Facebook page. Within about 20 minutes the chart had been shared more than 500 times and at last glance, the chart was making its way past 1,900 shares.
Senator Roberts provided corroborating facts and sources from the CDC but did not offer any commentary or opinions, just the chart. Smokey Barn News has added the chart below for your review.
“In the entire U.S., COVID-19 deaths peaked the week of April 18 with 16,374 deaths and have dropped steadily until the week of July 4th with 71 deaths.” Senator Kerry Roberts
For Smokey’s daily COVID-19 numbers for Robertson County click here.
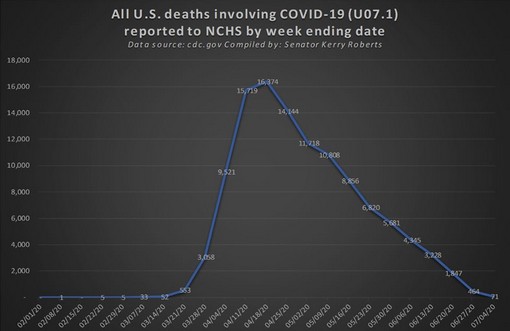
“There is much confusion over COVID-19 data and the context of the data, Senator Roberts’ stated. “The attached graph shows the weekly deaths through July 4, 2020, for the entire U.S. since the CDC started compiling the data on February 1, 2020. I took this data directly from the CDC’s website on July 7th and prepared the attached graph, which you are welcome to share. The raw data showing the week ended date and the number of deaths that week are below.”
02/01/20 0
02/08/20 1
02/15/20 0
02/22/20 5
02/29/20 5
03/07/20 33
03/14/20 52
03/21/20 553
03/28/20 3,058
04/04/20 9,521
04/11/20 15,719
04/18/20 16,374
04/25/20 14,144
05/02/20 11,718
05/09/20 10,808
05/16/20 8,856
05/23/20 6,820
05/30/20 5,681
06/06/20 4,345
06/13/20 3,228
06/20/20 1,847
06/27/20 464
07/04/20 71
Total 113,30

![]()
![]()