


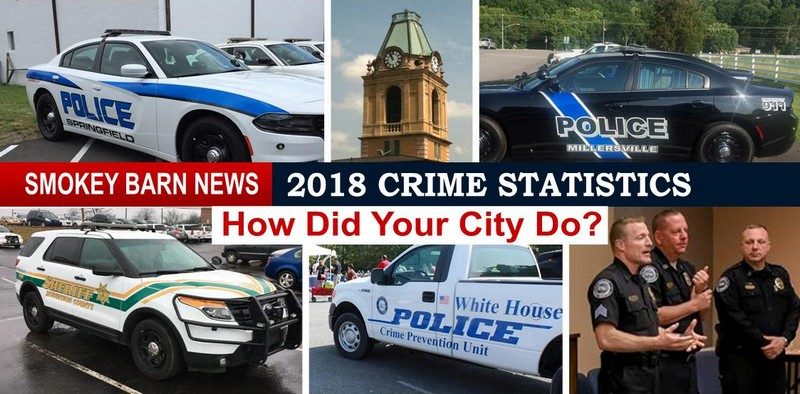
Annual Look At Crime (How Did Your City Do?) See The Numbers
ROBERTSON COUNTY TENNESSEE: (Smokey Barn News) – Throughout the year law enforcement agencies across the state report their crime totals to the TBI. At the end of each year, the TBI releases that data to offer cities and the State a way to look at how overall crime stats are trending.
Smokey Barn News took the numbers from 2017 and 2018 for cities in Robertson County and placed them side by side for your review. We have provided a brief summary for each city, but a link to the detailed numbers are listed for each city.
If your city does not have an independent police agency, like Orlinda and Adams, your stats will fall under the Robertson County Sheriff’s Office.
SPRINGFIELD
Violent crime in Springfield is down. In all the cities of Robertson County Springfield shows the most improvement especially if you take the numbers back to 2015. For several years Springfield seemed to be in the middle of a small crime wave but now violent crime is more in line with Springfield’s population numbers.
Springfield has worked closely with the Robertson County Sheriff’s office and other agencies going back to 2014 to get violent crime in the city under control. MORE Springfield Police Chief Jason Head offered the following statement with regard to the improved numbers.
”I am extremely pleased with the hard work and dedication that the men and women of the Springfield Police Department provide day and night to the City of Springfield. The 2018 crime data is only a small portion of the daily service that the officers and support staff provide to our citizens and visitors. We will continue to strive to provide professional law enforcement services for the City of Springfield.” Springfield Police Jason Head
NOTE: Even though crime is down overall in Springfield, two areas showed notable increases. The numbers on rape were up more than 50% in the 2017/18 reporting period as were DUI arrests which almost doubled.
To see all the Springfield crime numbers for your self (by crime) follow the link below.
Springfield, TN Police Dept. Stats 2017-2018 –> Click Here
GREENBRIER
To start out with, the overall numbers are small, as you might expect for a smaller city but there were three noticeable small spikes in the fraud category (Welfare, credit card, Identity theft) and aggravated assaults went from 10 reports to 20 for adults with 17 of those closed by police. The larger spike came in under the category of narcotics. There were 86 reported in 2017 and 103 reports in 2018. As you may have read, pharmacological related crime is up across the US.
Greenbrier Chief of Police Randy Pack offered the following take on the city’s numbers.
“Greenbrier, like many other cities has experienced an increase in narcotics-related offenses, especially those offenses that involve opioid-related narcotics. While we have a crime clearance rate of above 60% overall, associated drug and alcohol crimes such as domestic violence, assaults, and thefts increase as the drug problem increases. We remain dedicated to keeping Greenbrier a safe place to work and live and strive daily to make it so. While no police agency can completely stop crime due to its unpredictability, Greenbrier is blessed to have a majority of citizens who are law-abiding people and are willing to assist their police department when necessary.
“The 2018 TBI Crime Report reflects only part of the work the officers of the GPD are doing, as many cases are still in the investigatory stage or awaiting indictment and therefore are not reported as “cleared.” While we will never be completely satisfied with crime of any sort in Greenbrier, we feel strongly that the police department is proactively striving toward the goal of reducing it and prosecuting offenders to the extent that the law will allow.” Greenbrier Chief of Police Randy Pack
To see all the Greenbrier crime numbers for your self (by crime) follow the link below.
Greenbrier, TN Police Dept. Stats 2017-2018 –> Click Here
RIDGETOP
Ridgetop did see a spike in overall arrests, up from just 16 in 2017 to 70 in 2018. Again, narcotic-related arrests were up for Ridgetop, going from just 8 in 2017 to 48 in 2018. For all the numbers see the full report at the link below.
Ridgetop Police Chief Morris offered his perspective on the city’s numbers.
“I am very proud of our department as you can see from 2017 to 2018 our total offenses doubled. In that same time, we have gone from a clearance rate of 42% in 2017 to almost 80% in 2018. That’s unheard of considering our offenses doubled in that same time. Unfortunately, I do not see the crime rate slowing down as we all know our little city has stayed small and out of the turmoil that big cities have but it’s coming this way and from the looks of the crime report we need to stay on top of it and not let it get out of control. Again I could not be more proud of our department and the officers I have here. I like to think our training is a major part of our success.” Ridgetop Police Chief Morris
To see all the Ridgetop crime numbers for your self (by crime) follow the link below.
Ridgetop, TN Police Dept. Stats 2017-2018 –> Click Here
PORTLAND
Other than a small increase in reported crimes, the only real noticeable spike in Portland would be pharmacological or narcotics.
Portland Police Detective/Sergeant Jason Williams looked at the numbers this way.
“Here in Portland, we have seen a slight increase in reported crimes. This can be due to an increasing population, but can also be due to increased enforcement efforts, such as when an officer discovers a crime that would have otherwise gone unreported.
“We’ve seen a steady increase in our clearance rate as well, over the past several years, which we are obviously pleased with. Overall, we are headed in a positive direction, but there is always room for improvement. We hope to continue using a mixture of “old-fashioned”, and modern policing techniques, to make Portland a safer place to work and live.” Portland Police Detective/Sergeant Jason Williams
To see all the Portland crime numbers for your self (by crime) follow the link below.
Portland, TN Police Dept. Stats 2017-2018 –> Click Here
MILLERSVILLE
Millersville numbers were relatively flat other than a small spike in DUI arrests. The most unusual number fell under narcotic-related arrests. Defying the local and national trend Millersville’s numbers were down.
Millersville Chief of Police Mark Palmer has this to say about his city’s numbers.
“When comparing 2017 crime statistics to 2018 crime statistics, I am pleased to announce that our overall offenses decreased by 11.8 percent. We also had a 27 percent decrease in total drug offenses, which is a big concern in our community.
“We would like to think that this is a result of our proactive approach in dealing with the influx of people traveling through and moving to our community.
“Our goal is to make our citizens feel as safe as possible and we hope that we are meeting this goal.” Millersville Chief of Police Mark Palmer
To see all the Millersville crime numbers for your self (by crime) follow the link below.
Millersville, TN Police Dept. Stats 2017-2018 –> Click Here
WHITE HOUSE
White House also showed improvement in the numbers with one spike in line with the rest of the country. Narcotic-related arrests were up but the city’s closing rate remained on par with the previous year at roughly 95%.
White House Police Chief pat Brady had this to say about the numbers.
“After reviewing the TBI Crime Report we are grateful and proud that White House remains an extremely safe community. Burglaries dropped from 15 to 7, robberies dropped from 3 to 1, shoplifting dropped from 75 to 45, vehicle burglaries dropped from 40 to 39, (which is far below the 53 we had in 2015). We are very happy to see our juvenile arrests dropped from 69 to 40, which is the lowest number in over a decade.
“As other cities have seen an alarming increase in juvenile crime White House has seen a decrease. Connecting with and educating our youth remains a high priority. We believe that these numbers show that when working together with our citizens to promote safety, educate on crime, and empower all of our citizens to do their part to help keep White House safe, we continue to keep White House an outstanding community to raise our families.” White House Police Chief pat Brady
To see all the White House crime numbers for your self (by crime) follow the link below.
White House, TN Police Dept. Stats 2017-2018 –> Click Here
ROBERTSON COUNTY SHERIFF’S OFFICE
(Orlinda, Adams and other areas not within any city limits.)
County Sheriff’s Office numbers were also down. Total adult arrests went from 1098 to 885. Juvenile arrests did follow the national trend going from 100 to 131. Rape was down, even DUI’s were down. One strange note, pickpocketing made the chart, going from ZERO in 2017 to ONE in 2018. One could call that a 100% increase.
Robertson County Sheriff Michael Van Dyke offered the following on county crime stats.
“Overall, I am very pleased with the 2018 TIBRS report. 2018 is our best clearance rate that I know of since I have been at the Sheriff’s Office far exceeding the State average. Overall crime is down this past year for the Sheriff’s Office even as our population continues to climb for our County. We saw a 37% reduction in burglaries over 2017. We are going to continue a major focus on illegal drug enforcement which is the root of many other crimes.
“I am very proud of our Sheriff’s Office team and their hard work, and the working relationships with other law enforcement agencies. I am also grateful for the cooperation and help from the members of our community. The Sheriff’s Office has been successful because of the community’s support, information sharing, and willingness to report crimes and suspicious activity. We will continue to work together to provide a safe place to work, play, and raise our families.” Robertson County Sheriff Michael Van Dyke
To see all the Sheriff’s Office crime numbers for your self (by crime) follow the link below.
Robertson County, TN Sheriff’s Dept. Stats 2017-2018 –> Click Here
COOPERTOWN
Coopertown numbers were also good. The only mentionable small spike was in the theft category. Items being taken from vehicles and buildings saw a small spike.
To see Coopertown’s crime numbers for your self follow the link below.
Coopertown Police Dept. Stats 2017-2018 –> Click Here
CROSS PLAINS
The city’s police force has been in a transitional phase for about a year and that may be affecting reporting to the TBI. MORE Most of the city’s numbers were likely absorbed by the Sheriff’s office.
To see all the Cross Plains crime numbers for your self follow the link below.
Cross Plains, TN Police Dept. Stats 2017-2018 –> Click Here

Smokey Barn News (Advertisement)![]()
Smokey Barn News (Advertisement)
We bring you ALL the News in and surrounding Robertson County, Tennessee.

